Plot Bell Curve
Usage
plot_bell(
input,
metric = "z",
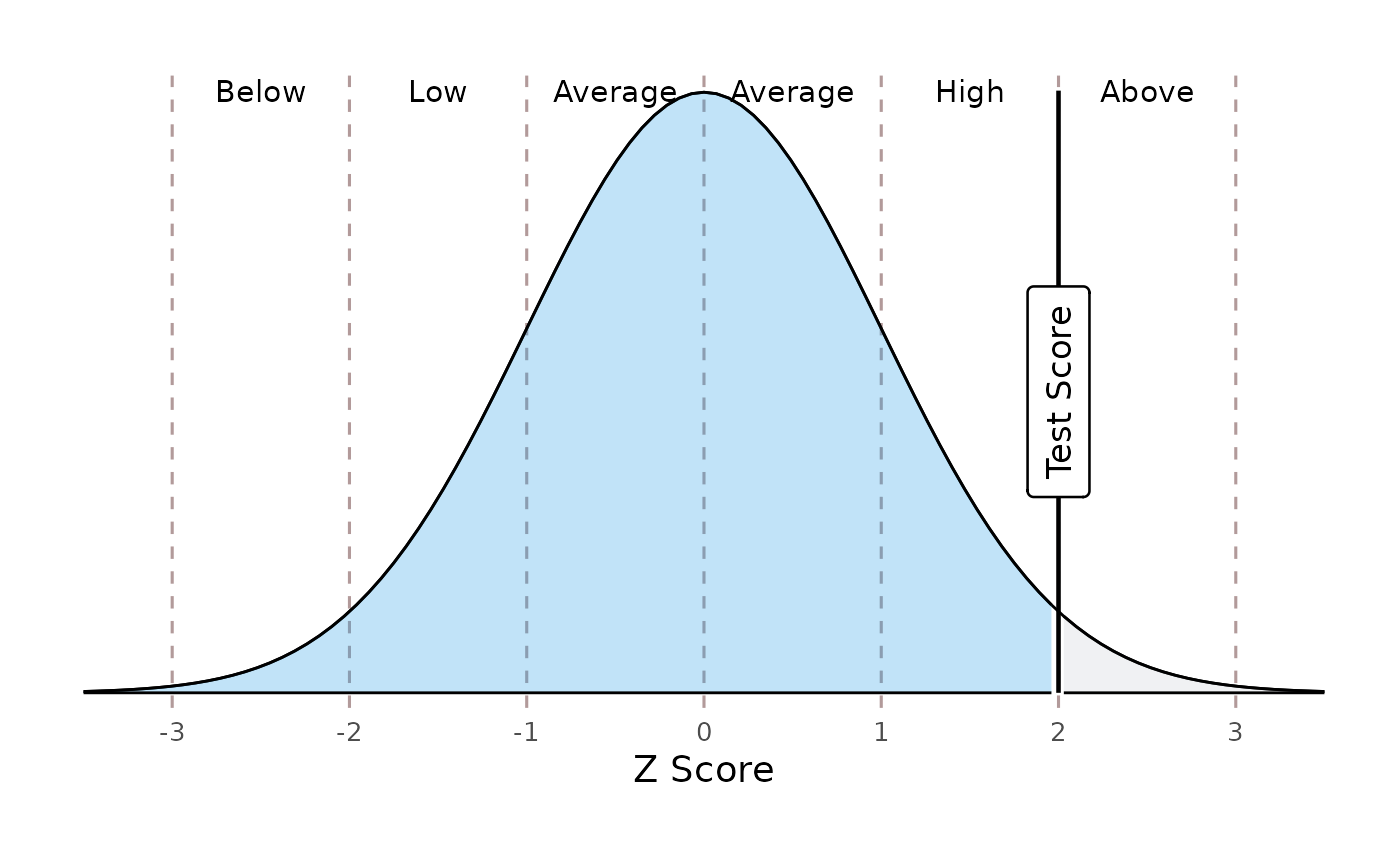
score.label.text = "test",
axis.label.metric = metric,
descriptors = TRUE,
color = "black",
text.color = "black",
area.over.fill = "#2fa4e7",
area.under.fill = "#ced4da",
alpha = 0.3
)Arguments
- input
A numeric value (or vector of numbers) representing the score(s) of interest. The function will adjust the score to the Z-score metric for plotting.
- metric
A character string specifying the metric of the input score: "percentile", "t", "index", "scaled", or "z" (default is "z").
- score.label.text
A character string (or vector of character strings) for the label text of the input score(s). Defaults to "test".
- axis.label.metric
A character string specifying the preferred metric label for x-axis labels: "percentile", "t", "index", "scaled", or "z" (default is "z").
- descriptors
A logical indicating whether to include descriptor labels ("Below", "Low", "Average", "High", "Above") on the plot (default is TRUE).
- color
A character string specifying the colour for the plot line (default is "black").
- text.color
A character string specifying the colour for the score labels (default is "black").
- area.over.fill
A character string specifying the colour for the area above the score (default is "#2fa4e7").
- area.under.fill
A character string specifying the colour for the area below the score (default is "#ced4da").
- alpha
A numeric value between 0 and 1 indicating the transparency of the shaded areas (default is 0.3).