Creates a forest plot visualizing scores and their confidence intervals across different tests and groups. The plot includes optional shading and descriptors to provide additional context.
Usage
plot_forest(
  data,
  score,
  metric = "z",
  test,
  group,
  ci.lb,
  ci.ub,
  axis.label.metric = metric,
  color = "black",
  z.lines = TRUE,
  z.line.color = "black",
  descriptors = TRUE,
  descriptors.color = "black",
  shading = TRUE,
  shading.color = "#2fa4e7",
  abbreviations = FALSE
)
Arguments
- data
A data frame containing the data to be plotted.
- score
The column name in the data frame representing the scores to be plotted.
- metric
The metric of the scores in the data frame. Defaults to "z". The metric can be converted to "z".
- test
The column name in the data frame representing the test names.
- group
The column name in the data frame representing the group names.
- ci.lb
(Optional) The column name in the data frame representing the lower bound of the confidence interval.
- ci.ub
(Optional) The column name in the data frame representing the upper bound of the confidence interval.
- axis.label.metric
The metric to be used for axis labels. Defaults to the value of
metric. Can be "percentile", "t", "index", "scaled", or "z".- color
of the points and errors bars. Defaults to "black".
- z.lines
(Optional) Logical value indicating whether to draw lines at z-scores from -4 to 4. Defaults to TRUE.
- z.line.color
(Optional) Color of the z-lines. Defaults to "black".
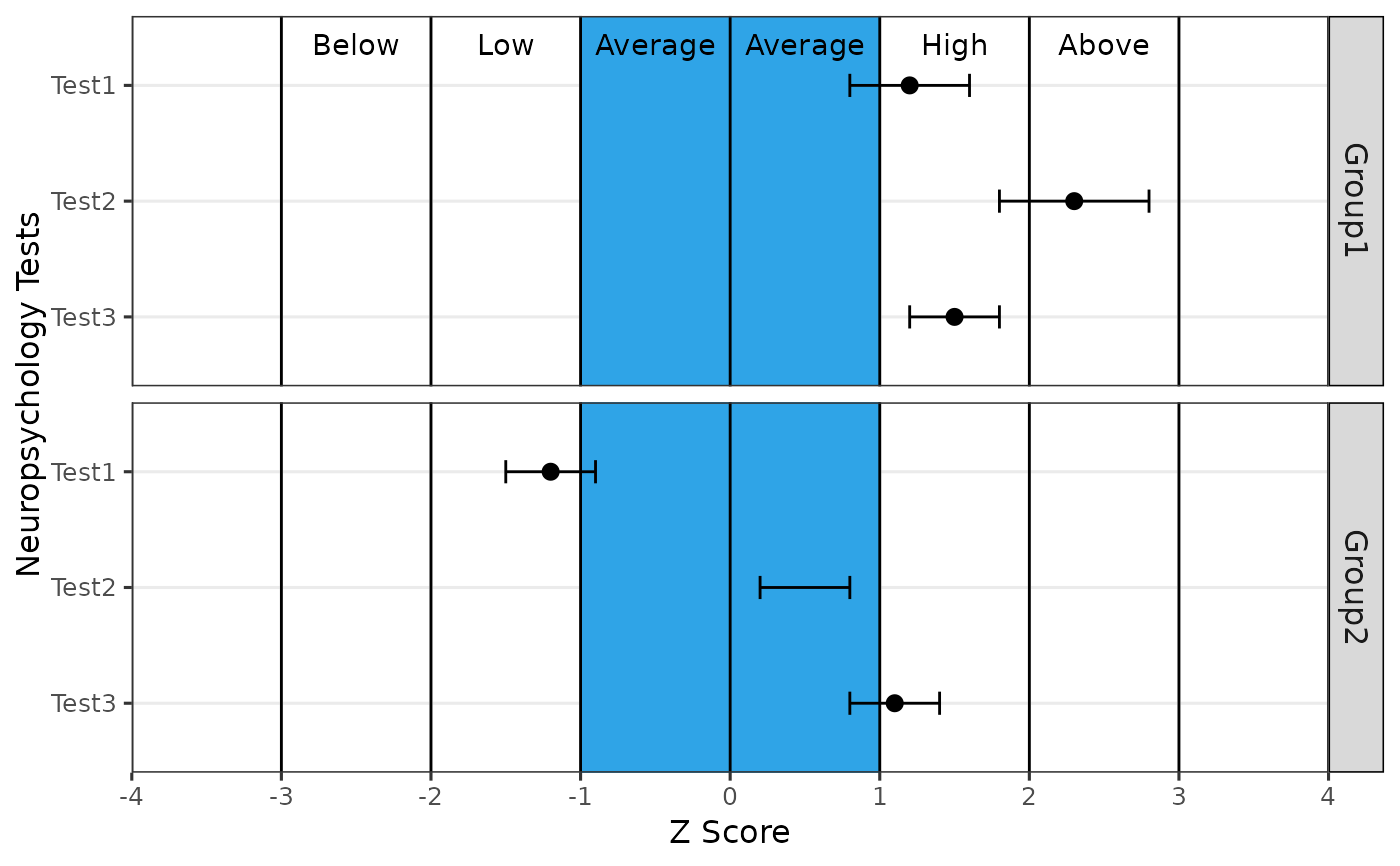
- descriptors
(Optional) Logical value indicating whether to include descriptive labels on the plot (e.g., "Below", "Average", "Above"). Defaults to TRUE.
- descriptors.color
(Optional) Color of the descriptor labels. Defaults to "black".
- shading
(Optional) Logical value indicating whether to include shading on the plot for the average range (e.g., z-scores between -1 and 1). Defaults to TRUE.
- shading.color
(Optional) Color of the shaded area. Defaults to "#2fa4e7".
- abbreviations
(Optional) Logical value indicating whether to abbreviate test names. Defaults to FALSE.
Examples
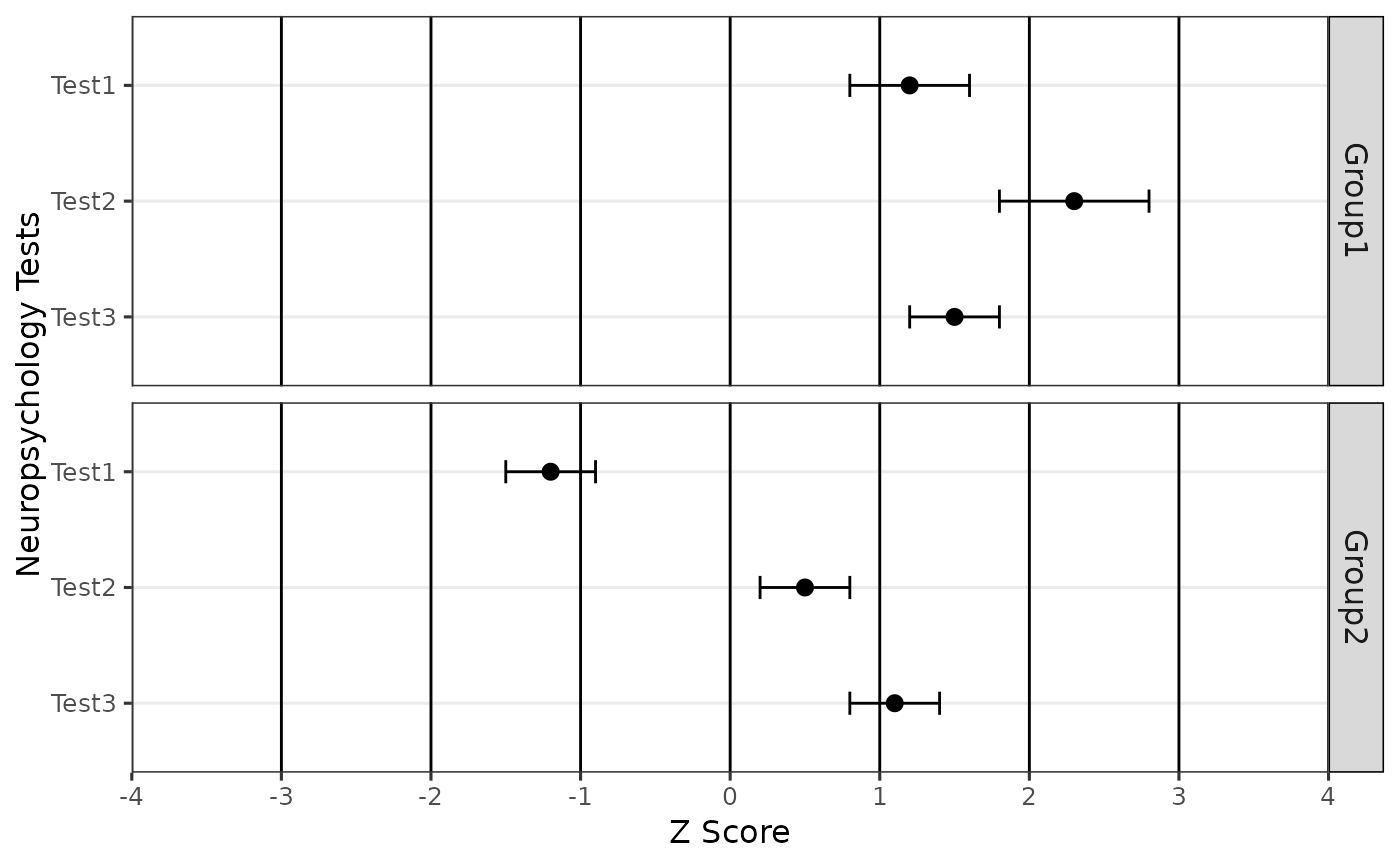
# Example data frame
df <- data.frame(
  test = rep(c("Test1", "Test2", "Test3"), 2),
  group = rep(c("Group1", "Group2"), each = 3),
  score = c(1.2, 2.3, 1.5, -1.2, 0.5, 1.1),
  ci.lb = c(0.8, 1.8, 1.2, -1.5, 0.2, 0.8),
  ci.ub = c(1.6, 2.8, 1.8, -0.9, 0.8, 1.4)
)

# Plot with default settings
plot_forest(df, score = score, test = test, group = group, ci.lb = ci.lb,
ci.ub = ci.ub)


# Plot with no descriptors and shading
plot_forest(df, score = score, test = test, group = group, ci.lb = ci.lb,
ci.ub = ci.ub, descriptors = FALSE, shading = FALSE)
# Plot with no descriptors and shading
plot_forest(df, score = score, test = test, group = group, ci.lb = ci.lb,
ci.ub = ci.ub, descriptors = FALSE, shading = FALSE)